Eclipse tips: remote debugging
In remote debugging, the virtual machine running the application you want to debug is launched outside the development environment with the VM parameters below. That makes it fairly straightforward to debug any Java application for which you have the source code.
-Xdebug -Xrunjdwp:transport=dt_socket,server=y,suspend=n,address=8000 (see the JDK documentation for what these parameters mean)
To demonstrate, we’ll create a simple Eclipse project with a single class, launch it from the command line and debug it remotely.
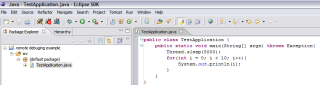

public class TestApplication {

 public static void main(String[] args) throws Exception{

 Thread.sleep(5000);

 for(int i = 0; i < 10; i++){

 System.out.println(i);

 }

 }

}
Java2html
Under Run >> Debug… >> Remote Java Application, click New to create a debug configuration.
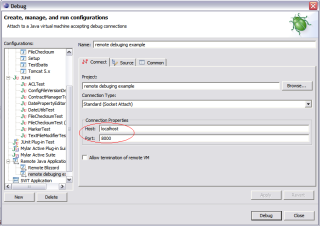

- Project — the Eclipse project containing the source files for the application you are debugging. The Source tab lets you add other source locations if needed, such as other projects, local directories or source archives.
- Connection type — the transport between the remote VM and Eclipse (a socket by default, see transport=dt_socket).
- Host — the host where the application will run.
- Port — the remote VM’s debug port (see address=8000).
We’re now ready for remote debugging. Launch the application with the JVM parameters above.
java -Xdebug -Xrunjdwp:transport=dt_socket,server=y,suspend=n,address=8000 TestApplication
Then start debugging in Eclipse as usual, selecting the configuration we just defined (in our example, remote debuging example).
Related articles
Medium version · Archived original page · Screenshots: Roman Pichlík, CC BY 3.0 · Historical Sweb link
Related articles
Related CZ Podcast episodes
- #261 · Leadership
On leading people and teams. · Czech audio
- #3 · Java 6 SE, Vývoj webových aplikací
Dagi and Filemon discuss Java 6 and web application frameworks. · Czech audio
- #1 · Vývojová prostředí v Javě
The first CZ Podcast episode looks at Java development environments. · Czech audio